Data Analysis : Reading Habit Analysis
Reading in the 21st century? Are you serious !!!

Dr. Suess, an American writer once said:
The more that you read, the more things you will know.
But how? How to read so much! Why read? How to get motivated to read? If you are in search of these answers, then you are on the right page!
In the quest to find the answer to the question: “What motivates you to read?”, I asked different people to respond to this question. Initially, I thought to write a simple article based on different responses I got. then I wondered if I could critically analyze the responses.
Hm… critically analyze! but, how?
Well, in this era when even kids are using Machine Learning for predicting the amount of Eidi they would get from their grandpa, why couldn’t we use Machine Learning for analyzing reading habit of different people.
So, to get started with our analysis, we need some material.
Things we need
- Dataset
- Machine Learning algorithms
- Kaggle.com
And I think we will run out of budget if we keep on adding stuff! so that’s enough for now…
Some Important Information about our dataset
There are 3 columns in the dataset, namely:
- Timestamp
- Gender
- What motivates you to Read articles, books, technology blog, news etc ?
We will only focus on the 3rd column.
- That will be used for the overall analysis of different responses we have in the dataset.
Now let’s move towards the real game.
Let the game begin!

- First of all, upload the dataset (.csv file) on Kaggle.
- Our Data is not ready for analysis as yet, because there could be many anomalies in it. For example; Missing values, stop words, punctuation marks, etc. We need to get rid of all this stuff, and this phenomenon is called data cleaning. To clean the data we will first extract the only column that we need to clean i.e. the column containing the answers to the question: “What motivates you to Read articles, books, technology blogs, news, etc ?”, Yes! the 3rd column. We will convert this column into an array using the below-mentioned code:
#to split the answers (just the last column of dataset i.e. 'What motivates you to Read articles, books, technology blogs, news etc ?' )
from collections import Counter
split = [] #empty array to store the result of splitted data
for i in range(48):
    s = df['What motivates you to Read articles, books, technology blogs, news etc ?'][i].lower().split()
    split+= s #adding splitted values in the empty list
print(split)
- Let’s now clean our data. The code below will do that:
from collections import Counter
import numpy as np
from nltk.corpus import stopwords
stop = stopwords.words('english')
useful_words = words[0].apply(lambda x: ''.join([word for word in x.split() if word not in (stop)]))  # removing English stop words from the dataset
#print(useful_words)
spacefree = pd.DataFrame(useful_words) #converting useful_words list into dataframe
spacefree[0].replace('', np.nan, inplace=True) #replacing empty strings with NAN in the dataframe
spacefree[0].replace('.', np.nan, inplace=True) #replacing . with NaN in the dataframe
spacefree[0].replace(',', np.nan, inplace=True) #replacing , with NAN in the dataframe
spacefree[0].replace('-', np.nan, inplace=True) #replacing - with NAN in the dataframe
Counter(spacefree[0].dropna(axis=0, how='any')) #droping all NAN from the dataframe
df_vals = spacefree[~spacefree[0].isnull()] #If previous dropna failed then this will drop all the null values from the dataframe, I don't know but this was working like this
df_vals
- df_vals data-frame looks like this:
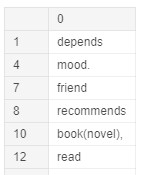
- Now that we have a neat and clean data (to some extent), we are ready to apply analytical techniques on this data.
Analysis
- The first technique that we are gonna use is clustering the words to get the most commonly used words along with their counts. Simple! like this:
Count = Counter(df_vals[0]) #to get the word count of cleaned data
C = Count.most_common(20) #to get 20 most common words with their count
C = pd.DataFrame(C)  #converting the 20 most common words with their word count into dataframe
- Let us plot 20 topmost commonly used words in response to the question, “What motivates you to Read ?”
#Plotting 20 most common words Dataframe with the help of a bar chart
C.plot.bar(x=0, y=1, rot=100)
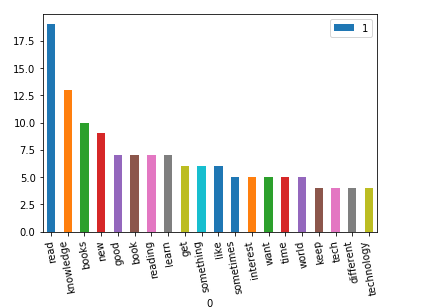
- It could be clearly seen in the above bar chart that “ Knowledge” is the most repetitive word after the word ‘read’.
- Let’s now apply decision tree classifier on our data. (Remember, we are just using the 3rd column of our original dataset for now).
- For keeping this article simple and result-focused, I am not going into the details of decision tree classification and how I used it. If you are interested in knowing the whole procedure that I followed, you can find it here. I got an accuracy score of 57.89.
- No doubt, an accuracy score of 57.89 is not so good. But still for the data containing only 47 rows :p this could be considered as Cool enough : )
Finally, let’s talk about the results or the answer to the question “What motivates “them” to read? ”
Answer
While analyzing the data, I found the following motivations behind the reading habit:
- To get “knowledge”.
- To get information about “new” technology.
- To keep up with the “world”.
- There “desire” to “read”.
- There “interest” in reading.
- To remain “up to date”.
Some other results
From the dataset, I also found:
- Most of the people prefer reading fictional books rather than digital articles and technology blogs.
- Those who read about non-fictional books and tech blogs is because this is their field’s requirement and they want to remain updated.
- Most of the people are not interested in news.
- One in one million, oh I mean… one in 47 people has no motivation to read.
- A large number of people consider “Reading” only as “reading extracurricular books”.

Yesss! we have analyzed the data…
But wait! you might be thinking about, “ where is the answer to: “How to get yourself motivated towards reading?” ”. So,
Here you go…
The dataset says:
The biggest motivation to read is, to get as much knowledge as you can in order to play your role most efficiently in this world. And to get the reward hereafter.
I once interviewed Dr. Zeeshan Ul Hassan Usmani (Data Scientist), and he said:
Try to learn as much as you can, do dozens of MOOCs every month, read a lot (min 100 pages a day) and keep your heads down. It’s not wise to have an opinion on everything at this stage. Flow like water and gather as much as you can in these years. Do not miss a single chance to travel, read, learn and network with good people.
In the end, I would like to thank everyone who has participated in the data collection phase in every respect. I hope you have enjoyed this article and have gotten your answers.
Stay Awesome :)
I know, min 100 pages a day are probably maximum :p
PS. originally published at medium.com


Comments
Post a Comment